PublicSphere Live
Capital Market
NGX ASI Sheds 794 Points as Selling Pressure Deepens; Market Capitalisation Falls to ₦159.2trn
Although trading volume improved marginally, the market’s inability to translate the higher volume into stronger turnover or positive index performance suggests that increased activity was not accompanied by broad-based buying conviction.
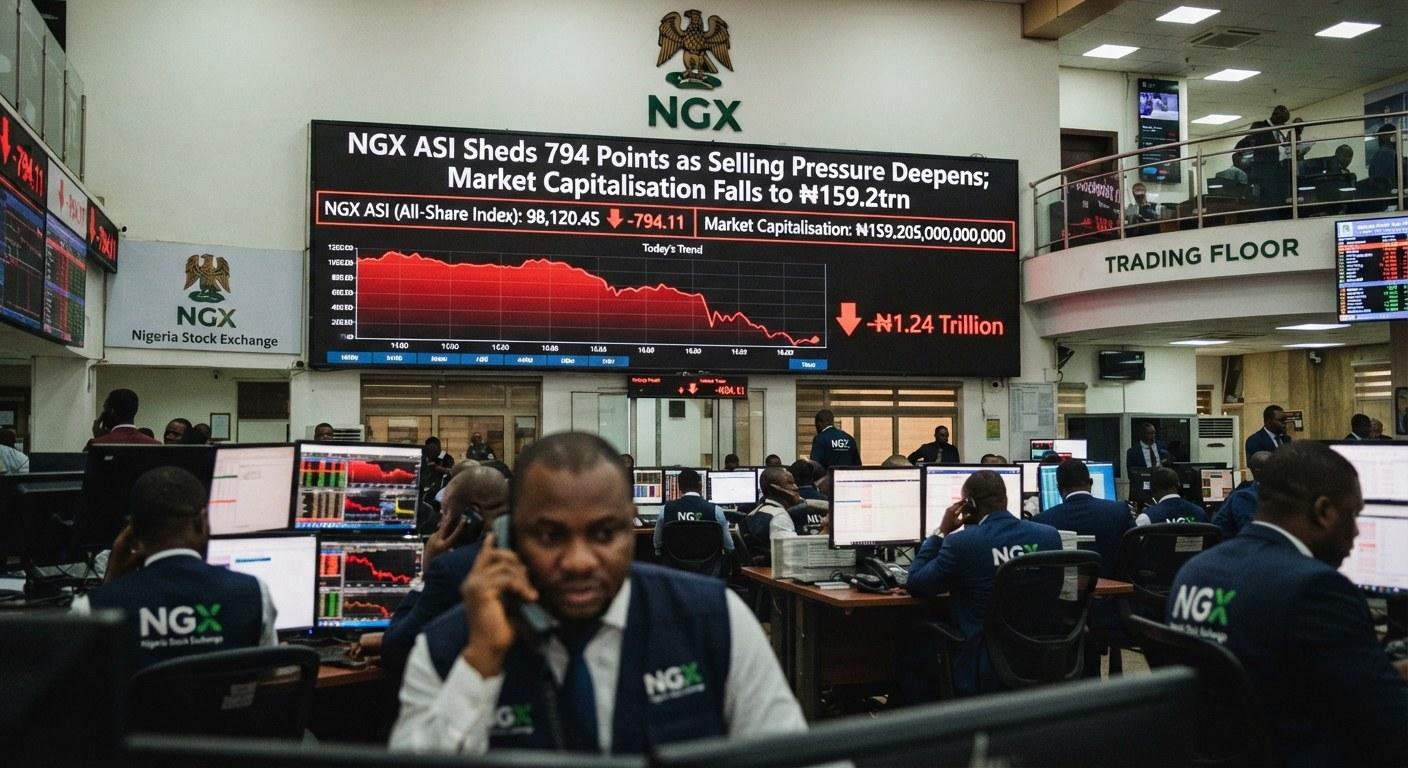
Nigeria’s equities market extended its bearish run on Wednesday as renewed selling pressure in several listed companies outweighed gains in selected stocks, dragging the Nigerian Exchange Limited’s All-Share Index (ASI) down by 794.64 points, or 0.32 per cent, to close at 245,116.49 points.
The decline reflected a market struggling to sustain its earlier bullish momentum despite maintaining a substantial year-to-date return of 57.52 per cent. Investors traded more shares than they did in the previous session, but the lower monetary value of transactions, the predominance of declining stocks and losses across several key market indices pointed to a cautious investment climate.
Market capitalisation stood at ₦159.2 trillion, equivalent to approximately $119 billion, while the number of losing equities more than doubled the number of gainers. Of the 133 equities that participated in trading, 18 advanced, 37 declined, and the remainder closed unchanged.
Although trading volume improved marginally, the market’s inability to translate the higher volume into stronger turnover or positive index performance suggests that increased activity was not accompanied by broad-based buying conviction.
Trading Volume Rises 2% As Turnover Falls 9%
Trading activity presented a mixed picture, with investors exchanging 354.03 million shares in 32,514 deals valued at ₦23.53 billion. Compared with Tuesday’s session, volume increased by approximately two per cent, but turnover declined by nine per cent, indicating that the additional shares traded did not translate into a corresponding increase in the value of transactions.
The divergence between volume and turnover is important in interpreting market sentiment. An increase in volume can indicate renewed interest in equities, but a fall in turnover may suggest that trading activity is concentrated in lower-priced stocks or that investors are transacting at less favourable prices. It does not, by itself, establish that investors are abandoning the market.
The combination of higher volume and lower turnover, however, suggests that Wednesday’s activity lacked the strength required to reverse the market’s negative direction. With 37 stocks declining against only 18 gainers, sellers maintained a clear numerical advantage.
The 32,514 deals recorded during the session also demonstrate that the market remained active despite the bearish outcome. Nevertheless, the quality and direction of that activity matter more than the volume alone. For a sustained recovery to emerge, increased trading participation would need to be accompanied by stronger buying interest in influential stocks and an improvement in market breadth.
Market capitalisation of ₦159.2 trillion placed the exchange at approximately $119 billion, underscoring the considerable size of the Nigerian equities market even as its benchmark index retreated.
The figures also suggest that investors were becoming more selective, with buying interest concentrated in a relatively small group of stocks while pressure persisted across a wider section of the market.
ASI Extends Its Losing Streak
The NGX All-Share Index closed at 245,116.49 points after losing 794.64 points, representing a daily decline of 0.32 per cent.
The benchmark’s performance is particularly significant because it provides a broad indication of changes in the prices of listed equities. Its decline indicates that losses among constituent stocks outweighed gains elsewhere, even though selected companies recorded substantial appreciation.
The index has now lost 1.03 per cent over one week and 2.19 per cent over four weeks. These figures point to growing pressure on near-term returns and suggest that the market has struggled to maintain the momentum that characterised its earlier advance.
Yet, the broader performance remains positive. The ASI’s year-to-date gain of 57.52 per cent indicates that investors who entered the market at the beginning of the year would, in aggregate, still be sitting on a substantial nominal appreciation in the benchmark.
That impressive year-to-date return provides important context for Wednesday’s decline. The market’s current weakness does not erase the gains accumulated over preceding months, but it raises questions about whether some investors are beginning to secure profits after the substantial appreciation in equity prices.
Following a prolonged rally, investors may become more sensitive to valuation levels, corporate earnings expectations and the attractiveness of alternative investments. Some may decide to lock in gains, while others may reduce exposure to companies whose prices have risen faster than their underlying earnings.
These are plausible explanations for the current weakness, rather than confirmed motives for every transaction recorded on Wednesday.
The ASI’s movement also highlights the difference between short-term market direction and longer-term performance. A market can remain significantly higher year to date while experiencing a sustained correction over several weeks.
For investors, the immediate question is whether the current decline represents a temporary consolidation after a strong rally or the beginning of a more prolonged adjustment. Wednesday’s statistics alone cannot settle that question, but the negative market breadth and weakness in several major indices warrant close monitoring.
NGX Top 30 And Pension Indices Under Pressure
The NGX Top 30 Index declined by 0.31 per cent on Wednesday, matching the broader market’s negative direction. Its one-week loss stood at 1.03 per cent, while its year-to-date return remained strong at 58.93 per cent.
The performance suggests that the weakness was not confined to smaller or less actively traded companies. The decline in the Top 30 Index indicates that leading stocks, as represented by the index, also faced selling pressure.
This is important because major companies can exert considerable influence on overall market performance through their size and index representation. When leading equities decline together, gains among smaller stocks may not be sufficient to offset the resulting losses.
The NGX Pension Index recorded a more pronounced daily decline of 0.58 per cent. It also lost 1.04 per cent over one week, although its year-to-date return remained at 78.9 per cent.
The pension index’s performance indicates that the weakness extended into the segment represented by its constituents. Its substantial year-to-date appreciation also means that the recent retreat has occurred against a backdrop of strong cumulative gains.
The divergence between its daily and year-to-date performance illustrates the potential for short-term corrections even in market segments that have delivered considerable returns over a longer period.
Investors will need to assess whether the recent weakness is being driven by broad valuation adjustments or company-specific developments. The supplied figures do not identify individual contributors to the pension index’s decline, so it would be premature to attribute the movement to particular stocks.
Oil And Gas Remains The Bright Spot
The NGX Oil and Gas Index was the standout performer among the indices reported, rising by 0.12 per cent despite the broader market’s decline.
Its performance was even more impressive over longer periods, with a one-week gain of 2.7 per cent and a year-to-date appreciation of 132.1 per cent.
The sector’s ability to advance against the broader market’s direction suggests that buying interest in oil and gas equities remained comparatively resilient. It also demonstrates that the day’s bearish sentiment was not universal.
The year-to-date gain of 132.1 per cent places the index among the strongest-performing segments in the supplied market statistics. Such appreciation may reflect favourable company-specific developments, earnings expectations, dividend prospects or changing investor perceptions of the sector.
However, the index’s daily increase was modest, and its performance should not be interpreted as evidence that all oil and gas companies advanced. An index reflects the combined performance of its constituents according to its methodology, and individual stocks may move in different directions.
Investors will also need to distinguish between oil prices and the profitability of individual listed companies. Crude prices, production volumes, operating costs, foreign-exchange movements, regulatory conditions and corporate financing arrangements can affect the financial performance of energy businesses in different ways.
The sector’s resilience nevertheless provides a useful counterpoint to the weakness elsewhere. If its positive momentum continues and is accompanied by improved performances in banking, industrial and consumer-related equities, it could contribute to a broader market recovery.
For now, the oil and gas index remains a relative source of strength in an otherwise weak trading session.
Industrial Index Holds Steady But Weekly Losses Persist
The NGX Industrial Index was virtually unchanged on Wednesday, recording a reported daily movement of approximately zero per cent. Despite this stability, the index had lost 1.76 per cent over one week.
Its year-to-date gain stood at 80.73 per cent, indicating that the industrial segment has delivered substantial appreciation since the beginning of the year.
The flat daily performance suggests that industrial equities, collectively, were more stable than the broader market during the session. However, the weekly decline indicates that the sector has not been entirely insulated from the recent correction.
Industrial stocks are particularly important to investors assessing Nigeria’s productive capacity and the outlook for domestic manufacturing, construction and infrastructure development.
Their performance can be influenced by foreign-exchange availability, energy costs, demand conditions, borrowing expenses, imported input prices and the ability of companies to pass rising costs on to customers.
For manufacturers and other industrial businesses, the relationship between revenue growth and operating expenses is particularly important. A company may record higher sales but still experience pressure on earnings if production costs rise more rapidly.
Wednesday’s flat index performance does not establish that these factors caused the market’s weakness. Rather, they represent the broader operating conditions investors typically consider when evaluating the prospects of industrial companies.
The sector’s 80.73 per cent year-to-date appreciation remains substantial, but its weekly decline suggests that investors are reassessing positions after the gains accumulated earlier in the year.
Main Board And Consumer Goods Show Different Patterns
The NGX Main Board Index declined by 0.07 per cent, a relatively mild movement compared with the All-Share Index’s 0.32 per cent loss.
The index gained 0.02 per cent over one week and recorded a year-to-date return of 43.03 per cent.
Its slight daily decline and marginal weekly gain suggest a more stable recent performance relative to the broader market. The difference also reinforces the importance of looking beyond the headline ASI to understand how different segments of the exchange are behaving.
The Main Board’s year-to-date return remains firmly positive, although it trails the reported returns of the Top 30, Industrial and Pension indices.
The NGX Consumer Goods Index, by contrast, fell by 0.43 per cent on Wednesday, making it one of the weaker indices in the supplied report.
Its one-week loss was comparatively modest at 0.17 per cent, while its year-to-date gain stood at just 1.24 per cent.
The consumer goods sector’s limited year-to-date appreciation contrasts sharply with the triple-digit return recorded by the oil and gas index and the substantial gains in industrial equities.
Consumer goods companies operate in a market where household purchasing power, input costs, distribution expenses, inflation and pricing decisions can have a direct effect on sales volumes and profit margins.
When consumers face pressure on disposable incomes, manufacturers may encounter difficulties increasing prices without sacrificing sales volumes. Companies must balance the need to protect margins against the risk of losing customers to cheaper alternatives.
Investors may therefore pay close attention to quarterly results, sales growth, debt-servicing costs, working capital and dividend sustainability when evaluating companies in this segment.
Nevertheless, the reported index performance alone cannot establish that weak consumer demand caused Wednesday’s decline. It shows only that consumer goods equities, as represented by the index, underperformed during the session.
The contrast between the sector’s 1.24 per cent year-to-date gain and the much stronger returns elsewhere is an important feature of the market’s uneven performance in 2026.
Gainers: Livingtrust Leads With 9.9% Appreciation
Despite the broader decline, several equities recorded substantial gains, demonstrating that investors continued to identify opportunities in individual companies.
Top gainers on Wednesday
Share-price appreciation reported for October 21, 2026.
LivingTrust Mortgage Bank
+9.90%
Closing price: ₦3.22
Associated Bus Company
+9.77%
Second on the gainers’ list.
Meyer
+9.72%
Third on the gainers’ list.
Livestock Feeds
+9.65%
Fourth on the gainers’ list.
LivingTrust Mortgage Bank led the market with a 9.90 per cent appreciation, closing at ₦3.22 per share. Associated Bus Company followed with a 9.77 per cent gain, while Meyer advanced by 9.72 per cent. Livestock Feeds completed the leading four with an increase of 9.65 per cent.
The performance of these stocks demonstrates that the market’s negative direction did not prevent substantial gains in individual equities. Investors may have been responding to company-specific developments, valuation considerations, trading demand or expectations about future performance.
However, price appreciation alone does not establish the reason for a stock’s movement. Without additional information on corporate announcements, financial results and order-book activity, it would be inappropriate to attribute these gains to particular developments.
The concentration of strong advances among a relatively small number of equities also reinforces the market’s selective character. With only 18 gainers against 37 losers, the advances were insufficient to reverse the overall negative trend.
For investors, the distinction between a stock’s daily momentum and its underlying investment value remains important. A sharp one-day increase does not automatically establish that a company’s earnings prospects have improved or that its share price will continue rising.
Losers: CWG Suffers The Biggest Decline
Selling pressure was more widespread than buying interest, with Computer Warehouse Group recording the steepest decline among the reported equities.
Top losers on Wednesday
Share-price depreciation reported for October 21, 2026.
Computer Warehouse Group
−9.98%
Closing price: ₦18.05
UPDC Real Estate Investment Trust
−9.93%
Second on the losers’ list.
Austin Laz & Company
−9.92%
Third on the losers’ list.
Neimeth International Pharma
−9.52%
Fourth on the losers’ list.
Computer Warehouse Group declined by 9.98 per cent to close at ₦18.05 per share, making it the session’s worst-performing equity in the supplied report. UPDC Real Estate Investment Trust followed with a 9.93 per cent loss, while Austin Laz & Company fell by 9.92 per cent. Neimeth International Pharma recorded a 9.52 per cent depreciation.
The magnitude of these declines indicates substantial downward price adjustments in the affected stocks. However, it is important to distinguish between individual share-price movements and the broader market’s direction. These losses do not necessarily imply that the companies experienced comparable changes in their underlying business performance during the session.
The declines may reflect company-specific developments, profit-taking, changing demand, valuation adjustments or other trading factors, but the supplied statistics do not establish which explanation applied to each company.
Austin Laz & Company’s presence among both the leading gainers and losers in conflicting market summaries also underlines the importance of using a single verified end-of-day dataset before drawing definitive conclusions. The analysis here follows the supplied closing report, in which Austin Laz is classified among the losers.
The appearance of technology-related, real estate, pharmaceutical and other stocks among the leading decliners suggests that weakness was not restricted to one business category.
For investors, such declines make it particularly important to review corporate announcements, audited financial statements, liquidity, earnings outlook and valuation before interpreting price movements as either buying opportunities or warnings of deteriorating fundamentals.
Zenith Bank Leads Trading Volume
Banking stocks dominated the list of the most actively traded equities, highlighting the continuing importance of the financial sector to trading activity on the Nigerian Exchange.
Zenith Bank recorded the highest volume, with 48.2 million shares traded. Access Holdings followed with 41 million shares, while Fidelity Bank recorded 20.4 million shares. Guaranty Trust Holding Company completed the leading group with 13.9 million shares.
Most actively traded equities
Reported trading volume on October 21, 2026, in millions of shares.
The four banks collectively accounted for 123.5 million shares, equivalent to approximately 34.9 per cent of the entire market volume of 354.03 million shares.
This concentration illustrates the significant contribution of major banking equities to market liquidity. High trading volumes in banking stocks can reflect their broad investor ownership, trading liquidity and importance in portfolio allocation.
Nevertheless, volume should not be confused with positive performance. A stock can record heavy trading because investors are buying, selling or adjusting positions in response to changing expectations. The volume figure alone does not reveal the balance between buying and selling pressure or establish whether the shares closed higher or lower.
The banking sector’s prominent place in trading activity also makes its future performance important to the wider market. A sustained improvement in banking stocks could support market sentiment, while further declines in heavily traded constituents could contribute to continued pressure on the benchmark.
To establish the precise contribution of these banks to Wednesday’s ASI movement, their individual closing prices, market weights and index contributions would need to be examined.
What Shaped Wednesday’s Market Performance?
Several features of the trading report help explain the market’s direction, although the statistics do not independently establish the underlying causes of every transaction.
First, negative market breadth reinforced the bearish trend. With 37 losers against 18 gainers, declining equities outnumbered advancing stocks by more than two to one. This indicates that the weakness extended beyond a handful of companies.
Second, profit-taking remains a plausible explanation for some of the selling pressure. The ASI’s 57.52 per cent year-to-date appreciation and the particularly strong returns in the oil and gas, industrial and pension indices provide a basis for investors to reassess their positions. After substantial gains, some shareholders may choose to realise profits, particularly where they consider valuations stretched. However, the data do not confirm profit-taking as the sole or principal cause of Wednesday’s decline.
Third, investors may be differentiating more carefully between sectors and individual companies. The oil and gas index advanced while consumer goods and pension indices declined, and the industrial index remained virtually unchanged. Such divergence is consistent with selective positioning rather than uniform buying or selling across the market.
Fourth, the relationship between volume and turnover suggests that higher activity did not translate into greater transaction value. Volume rose by two per cent while turnover fell by nine per cent. This divergence points to a change in the composition or pricing of transactions, although a more detailed breakdown would be necessary to determine its precise explanation.
Fifth, the market’s short-term trajectory may be influencing investor caution. A one-week loss of 1.03 per cent and a four-week decline of 2.19 per cent suggest that recent weakness has become more persistent. Investors may therefore be paying closer attention to earnings announcements, dividend expectations, valuation levels and broader economic developments before committing additional funds.
These factors should be considered alongside prevailing interest rates, inflation, exchange-rate conditions, corporate earnings and developments in the domestic and international economies. Such variables influence equity valuations and investor expectations, but Wednesday’s trading summary does not establish the extent to which each contributed to the outcome.
Outlook: Investors Watch For A Sustainable Recovery
The immediate outlook for the Nigerian equities market will depend on whether buying interest can broaden beyond a limited group of advancing stocks and stabilise the benchmark index.
The ASI’s 57.52 per cent year-to-date gain provides evidence of the market’s strong cumulative performance, but the recent weekly and monthly declines suggest that investors should not assume the earlier rally will continue without interruption.
A more convincing recovery would likely require improvement in market breadth, stronger participation in high-capitalisation stocks and a return to positive index performance supported by sustained buying interest. A further rise in trading volume would be more encouraging if it were accompanied by higher turnover and a larger number of advancing equities.
The oil and gas sector’s resilience could offer some support, given its 132.1 per cent year-to-date appreciation. However, continued weakness in consumer goods, pension-related constituents and major market stocks could limit the potential for a broad-based rebound.
Investors should also avoid interpreting a sharp fall in an individual equity as an automatic bargain. Before making investment decisions, they need to consider company fundamentals, earnings quality, debt exposure, dividend sustainability, liquidity and valuation, alongside their own investment objectives and tolerance for risk.
Equally, a stock’s strong daily appreciation should not be treated as proof that its price will continue rising. Market breadth and sustained performance over several sessions provide a more useful indication of whether buying interest is becoming durable.
Conclusion
Wednesday’s trading session presented a market characterised by substantial cumulative gains but persistent near-term weakness. The ASI lost 794.64 points to close at 245,116.49, while market capitalisation stood at ₦159.2 trillion.
The increase in trading volume offered evidence of continued market participation, but the decline in turnover and the predominance of losing stocks pointed to limited buying strength. The oil and gas index provided a notable exception to the wider weakness, while the consumer goods and pension indices recorded declines.
Zenith Bank, Access Holdings, Fidelity Bank and GTCO led trading by volume, demonstrating the importance of major banking stocks to overall market activity. Meanwhile, LivingTrust Mortgage Bank topped the gainers, and Computer Warehouse Group recorded the steepest decline.
The central message for investors is that the market remains significantly positive year to date, but recent losses call for a more discriminating approach to stock selection. Whether the present weakness develops into a deeper correction or gives way to renewed gains will depend on the breadth and sustainability of buying interest, corporate performance and the economic conditions shaping investment decisions.